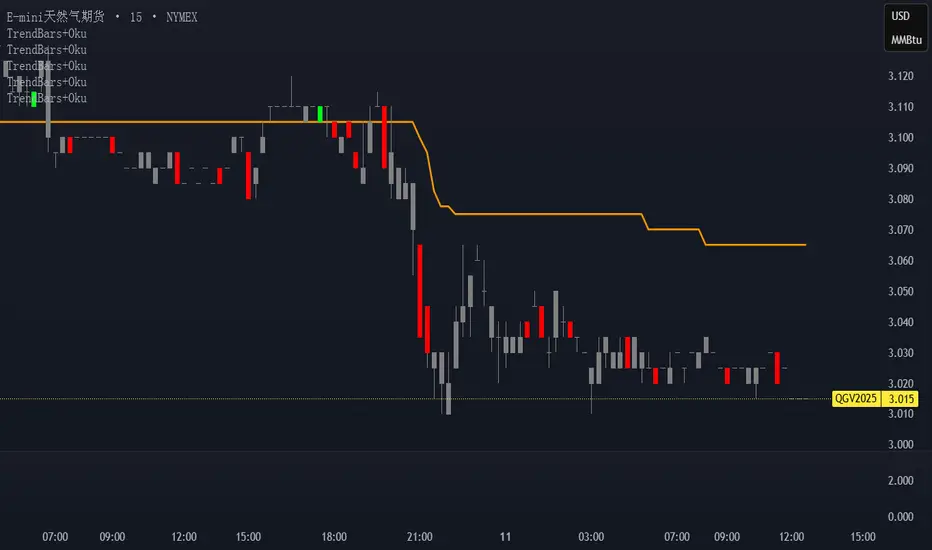
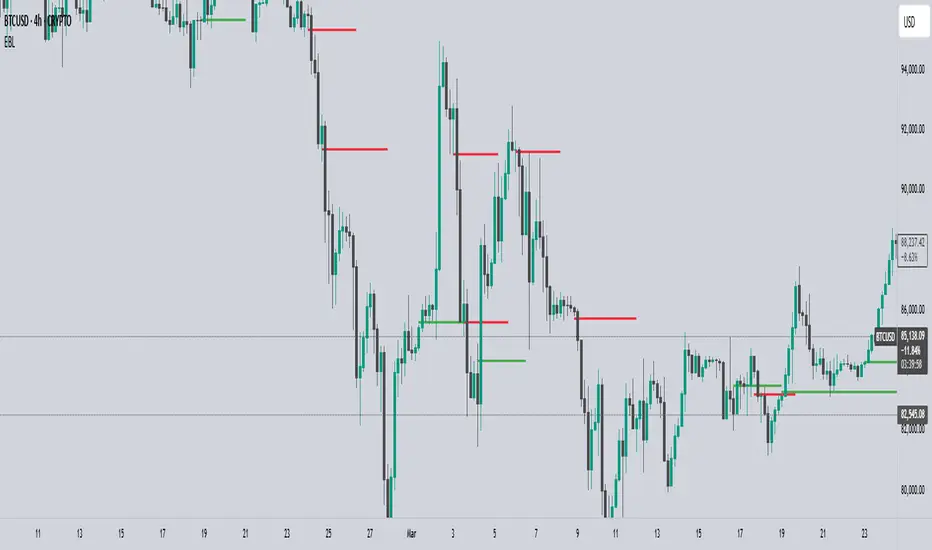
Trend Bars with Okuninushi Line Filter# Trend Bars with Okuninushi Line Filter: A Powerful Trading Indicator
## Introduction
The **Trend Bars with Okuninushi Line Filter** is an innovative technical indicator that combines two powerful concepts: trend bar analysis and the Okuninushi Line filter. This indicator helps traders identify high-quality trending moves by analyzing candle body strength relative to the overall price range while ensuring the price action aligns with the dominant market structure.
## What Are Trend Bars?
Trend bars are candles where the body (distance between open and close) represents a significant portion of the total price range (high to low). These bars indicate strong directional momentum with minimal indecision, making them valuable signals for trend continuation.
### Key Characteristics:
- **Strong directional movement**: Large body relative to total range
- **Minimal upper/lower shadows**: Shows sustained pressure in one direction
- **High conviction**: Represents decisive market action
## The Okuninushi Line Filter
The Okuninushi Line, also known as the Kijun Line in Ichimoku analysis, is calculated as the midpoint of the highest high and lowest low over a specified period (default: 52 periods).
**Formula**: `(Highest High + Lowest Low) / 2`
This line acts as a dynamic support/resistance level and trend filter, helping to:
- Identify the overall market bias
- Filter out counter-trend signals
- Provide confluence for trade entries
## How the Indicator Works
The indicator combines these two concepts with the following logic:
### Bull Trend Bars (Green)
A candle is colored **green** when ALL conditions are met:
1. **Bullish candle**: Close > Open
2. **Strong body**: |Close - Open| ≥ Threshold × (High - Low)
3. **Above trend filter**: Close > Okuninushi Line
### Bear Trend Bars (Red)
A candle is colored **red** when ALL conditions are met:
1. **Bearish candle**: Close < Open
2. **Strong body**: |Close - Open| ≥ Threshold × (High - Low)
3. **Below trend filter**: Close < Okuninushi Line
### Neutral Bars (Gray)
All other candles that don't meet the complete criteria are colored **gray**.
## Customizable Parameters
### Trend Bar Threshold
- **Range**: 10% to 100%
- **Default**: 75%
- **Purpose**: Controls how "strong" a candle must be to qualify as a trend bar
**Threshold Effects:**
- **Low (10-30%)**: More sensitive, catches smaller trending moves
- **Medium (50-75%)**: Balanced approach, filters out most noise
- **High (80-100%)**: Very selective, only captures the strongest moves
### Okuninushi Line Length
- **Default**: 52 periods
- **Purpose**: Determines the lookback period for calculating the midpoint
- **Common Settings**:
- 26 periods: More responsive to recent price action
- 52 periods: Standard setting, good balance
- 104 periods: Longer-term trend perspective
## Trading Applications
### 1. Trend Continuation Signals
- **Green bars**: Look for bullish continuation opportunities
- **Red bars**: Consider bearish continuation setups
- **Gray bars**: Exercise caution, mixed signals
### 2. Market Structure Analysis
- Clusters of same-colored bars indicate strong trends
- Alternating colors suggest choppy, indecisive markets
- Transition from red to green (or vice versa) may signal trend changes
### 3. Entry Timing
- Use colored bars as confirmation for existing trade setups
- Wait for color alignment with your market bias
- Avoid trading during predominantly gray periods
### 4. Risk Management
- Gray bars can serve as early warning signs of weakening trends
- Color changes might indicate appropriate exit points
- Use in conjunction with other risk management tools
## Advantages
1. **Dual Filtering**: Combines momentum (trend bars) with trend direction (Okuninushi Line)
2. **Visual Clarity**: Immediate visual feedback through candle coloring
3. **Customizable**: Adjustable parameters for different trading styles
4. **Versatile**: Works across multiple timeframes and instruments
5. **Objective**: Rule-based system reduces subjective interpretation
## Limitations
1. **Lagging Nature**: Based on historical price data
2. **False Signals**: Can produce whipsaws in choppy markets
3. **Parameter Sensitivity**: Requires optimization for different instruments
4. **Market Conditions**: May be less effective in ranging markets
## Best Practices
### Optimization Tips:
- **Volatile Markets**: Use higher thresholds (80-90%)
- **Steady Trends**: Use moderate thresholds (60-75%)
- **Short-term Trading**: Shorter Okuninushi Line periods (26)
- **Long-term Analysis**: Longer Okuninushi Line periods (104+)
### Combination Strategies:
- Pair with volume indicators for confirmation
- Use alongside support/resistance levels
- Combine with other trend-following indicators
- Consider market context and overall trend direction
## Conclusion
The Trend Bars with Okuninushi Line Filter offers traders a sophisticated yet intuitive way to identify high-quality trending moves. By combining the momentum characteristics of trend bars with the directional filter of the Okuninushi Line, this indicator helps traders focus on the most promising opportunities while avoiding low-probability setups.
Remember that no single indicator should be used in isolation. Always consider market context, risk management, and other technical factors when making trading decisions. The true power of this indicator lies in its ability to quickly highlight periods of strong, aligned price action – exactly what trend traders are looking for.
---
*Disclaimer: This article is for educational purposes only and should not be considered as financial advice. Always conduct your own research and consider your risk tolerance before making any trading decisions.*
Wskaźnik Pine Script®